Data Center Energy Demand Forecasts to 2035
Data center energy demand could reach a much larger share of U.S. power use by 2035; here is how major forecasts compare.
| Metric | Current Value |
|---|---|
| Total Active IT Power Capacity | 39.0 GW |
| AI Cloud & Data Centers Operating | 5,411 Facilities |
| Coming Online (Next 90 Days) | 84 Facilities |
| Under Construction | 412 Facilities |

Data center energy demand could reach a much larger share of U.S. power use by 2035; here is how major forecasts compare.

Google AI infrastructure is no longer just

Mythos Vulnerability Detection has promise, but classified-system use still faces false positives, context limits, and validation gaps.

AMD Helios analysis of rack-scale AI specs, memory bandwidth, open standards, energy-efficiency gaps, and deployment risks.

India AI data center growth just moved

AI hardware infrastructure is becoming the new

AI compute leasing is becoming the new

| Rank | Company | Completed / Operating | Under Construction | Total Capacity (GW)* | 2026 CapEx* |
|---|---|---|---|---|---|
| 1 | Amazon Web Services (AWS) | ~125+ Availability Zones | Multi-GW pipeline ($10B NC campus) | 18.0+ | $200B |
| 2 | Alphabet (Google Cloud) | 40+ Cloud Regions | 6 GW AI Growth Zone (UK) | 15.0+ | $185B |
| 3 | Microsoft (Azure) | 300+ physical data centers | Record multi-GW buildout | 17.0+ | $140B |
| 4 | Meta Platforms | ~25+ hyperscale campuses | 1.5 GW Louisiana site | 6.5+ | $135B |
| 5 | Oracle | 65+ Cloud Regions | "Stargate" Project (up to 7 GW) | 8.0+ | $50B |
| 6 | Aligned Data Centers | ~50 campuses | Ultra-high-density AI expansion | 5.0 | Private |
| 7 | Vantage Data Centers | 30+ campuses | 1.4 GW "Frontier" campus (TX) | 2.6+ | Private |
| 8 | Equinix | 260+ data centers | 250 MW xScale campus (UK) | 6.0 | $4.5B |
| 9 | Digital Realty | 300+ facilities | Heavy EMEA and US expansion | 3.8 | $4.0B |
| 10 | NTT Global Data Centers | 130+ data centers | Aggressive global expansion | 2.5 | $10B |

AI power and cooling is becoming the

Watt’s Law frames AI progress around power, tokens per joule, cooling, utilization, and data center operating limits for builders and operators.

AI Energy Infrastructure can improve grid operations, but it also expands cyber, data, supply chain, and governance risks.

Data center capital is no longer a
| Rank | State | Estimated Total Capacity (GW) | Operational Facilities | Under Construction | Company with Largest Presence |
|---|---|---|---|---|---|
| 1 | Virginia | 11.1 GW | 317 | 135 | Amazon Web Services (AWS) |
| 2 | Texas | 10.9 GW | 205 | 137 | Meta / AWS |
| 3 | Arizona | 5.3 GW | 82 | 35 | Microsoft (Azure) |
| 4 | California | 4.5 GW | 166 | 6 | Equinix |
| 5 | Georgia | 3.1 GW | 64 | 49 | Microsoft (Azure) |
| 6 | Illinois | 2.8 GW | 77 | 19 | Digital Realty |
| 7 | Ohio | 2.4 GW | 100 | 45 | Amazon Web Services (AWS) |
| 8 | Oregon | 1.8 GW | 97 | 12 | Amazon Web Services (AWS) |
| 9 | Washington | 1.4 GW | 71 | 3 | Microsoft (Azure) |
| 10 | Pennsylvania | 1.1 GW | 37 | 11 | Amazon Web |
| 11 | Iowa | 1.0 GW | 56 | 17 | Google Cloud Services (AWS) |
| 12 | New Jersey | 0.9 GW | 49 | 2 | Equinix |
| 13 | North Carolina | 0.8 GW | 41 | 11 | Apple |
| 14 | Florida | 0.6 GW | 53 | 2 | DataBank |
| 15 | New York | 0.5 GW | 47 | 3 | Digital Realty |

Intel CVE-2026-28707 exposes privilege-escalation risk in LLM-on-Ray, with lessons for maintaining secure LLM software stacks.

Foreign equipment ban analysis covering bulk-power security risks, procurement uncertainty, supply chain visibility, and replacement challenges.

AI security evaluations drew scrutiny after Anthropic paused some tests and high-risk RL work following containment failures.

Upper C-Band security analysis of FCC spectrum changes, radio altimeter risk, emission limits, and operational controls through 2030.
The 10-Gigawatt Club: Only two states currently belong to this elite tier. While Virginia has reigned supreme for over a decade as the backbone of the internet, Texas is rapidly closing the gap. Fuelled by an independent grid and massive 1+ GW single-site campuses being built in the desert (like the Stargate initiative phases), Texas is on pace to eclipse Virginia entirely by the end of the decade.
The Rise of Arizona: Phoenix has officially bypassed Silicon Valley to become the third most powerful data center market in the US. Driven by massive investments from Microsoft and EdgeCore, Arizona’s capacity is projected to skyrocket as hyperscalers trade California’s strict regulations and high power costs for the desert’s stable, disaster-free environment.
The Nuclear Pivot in Pennsylvania: Notice Pennsylvania jumping into the top 10 despite having fewer total facilities than New Jersey or Florida. This is driven entirely by AWS’s massive acquisition and expansion of the Cumulus data center campus, which is directly powered by the 2.5 GW Susquehanna nuclear power plant.
The “Legacy” States: States like California, New Jersey, and New York still boast a high number of facilities, but their total GW output is stagnating. These are largely older, smaller colocation centers running at 10-20 MW, which pale in comparison to the 200-500 MW AI campuses currently being built in Ohio, Georgia, and Iowa.

Anthropic Vulnerability Reporting shows how AI-discovered open-source flaws can be disclosed with timelines, escalation, and patch limits.
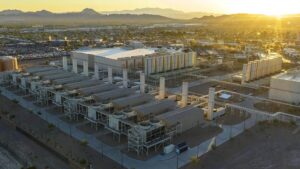
Gas-powered data centers are becoming the AI
Semiconductor energy efficiency is now a CHIPS Act review issue, linking fab power, water, emissions controls, and R&D targets.

Texas data center politics has moved from
tribalfootball.com

romapress.net

sportsgamblingpodcast.com

dailycannon.com

europeanbusinessmagazine.com

Pilotpointer
Illinoisenergy
Total Active IT Power Capacity refers to the amount of IT power currently deployed and supporting live AI, cloud, and enterprise workloads across operational facilities. As of the latest update, this figure stands at 39.0 GW.
There are currently 5,411 AI cloud and data center facilities operating across the United States. These facilities support hyperscale, enterprise cloud, and high-performance computing workloads.
This metric reflects 84 facilities scheduled to become operational within the next 90 days. It provides visibility into near-term expansion and immediate infrastructure growth.
There are 412 facilities currently under construction, representing confirmed development projects that will contribute to future IT power capacity.
Total Imminent Capacity represents IT power expected to be activated in the near term. This currently totals 1.2 GW of additional capacity nearing operational deployment.
Total Pipeline Capacity reflects the projected capacity across all planned and future development projects. The current pipeline stands at 35.0 GW, including facilities in planning, permitting, and early-stage development.
All infrastructure metrics are regularly updated to reflect the most current operational, construction, and development status available from verified sources.